We (Climate Museum UK) are now piloting our Make Climate History project. Events have happened in Bromley and in Norwich, and this format is looking successful enough to keep rolling out. It should work very well with large groups, such as in schools and conferences. Everywhere could have its own local Make Climate History striped mural to show what happened over the past 130+ years to create this situation, and what we want to come next.
Here’s how we made it locally relevant:
Friday 23rd February was the climate-themed day of the Norwich Science Festival, and the big Forum building at the heart of the City was full of activities on the subject. We were there to help people learn and have their say about climate change.
All day long, families of all backgrounds told us they were worried and could feel the effects of a disrupted climate. Norfolk is at high risk from climate change with low-lying land and the fastest eroding coastline in Europe. There have been multiple flood warnings since October, many rural communities have struggled with closed roads, and farmers are anxious about sodden fields affecting their crops. We heard children echo their families’ experiences. They asked why adults had let global temperatures rise so fast, as 2023 was at 1.5C above the pre-industrial global average and ocean temperatures are at extreme highs. This means that international efforts to limit warming to 1.5C have failed and that we must accept this is now an age of climate breakdown. We didn’t go into the more alarming or political details with children but let them express their own views, feelings and questions. Most of all they expressed worries about how pollution affects soil, air and water, pollinators and marine life. And they wanted to know how they could help.
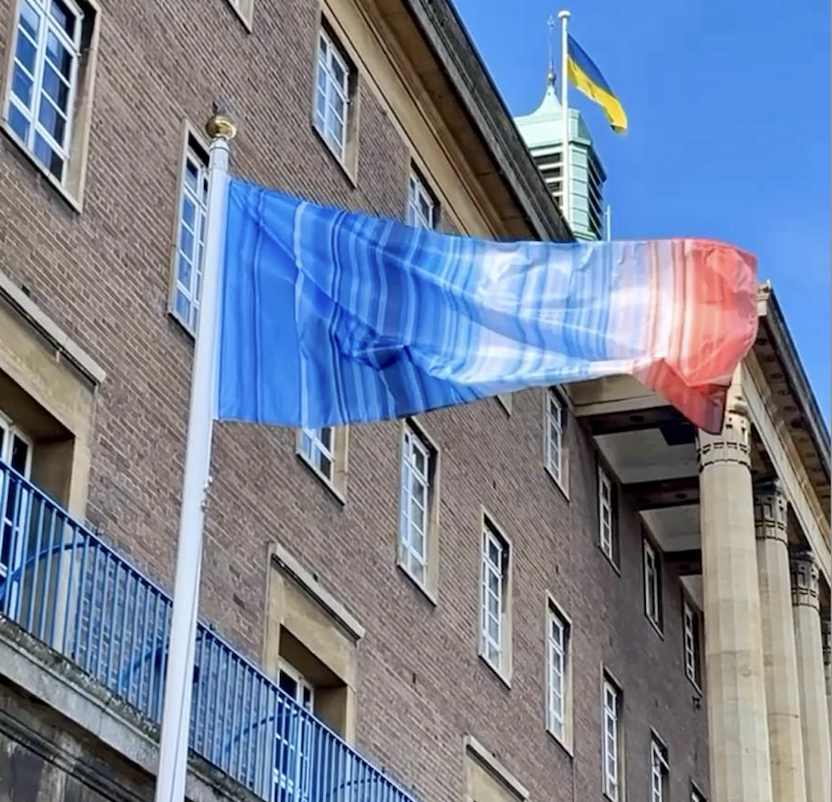
The City Council flew a flag of the Warming Stripes showing how Norwich temperatures have risen from cool blue to hot red over 138 years. This code of blue-to-red colours for annual global temperatures was developed by climate scientist, Ed Hawkins, at the University of Reading. Since 2018, these stripes have been appearing everywhere – on mugs, ties, fences and social media – with the hashtag #ShowYourStripes. For our mural, we printed out coloured stripes computed for Norwich temperatures by Michael Taylor (CRU/UEA) from UK Met Office CP18 data. What’s significant with the Norwich version of the stripes is that you can’t easily see a difference from the stripes for Europe, or the world. The planet is definitely warming, and everywhere is affected, although the Global North is contributing a lot more than the poorer South. It’s time for us to play our part in Northern cities like Norwich, and to find ways to do this that improve our well-being and economy. The City Council environment team was present at the Festival, consulting people about their climate action plan.
Our aim with ‘Make Climate History’ is to help people come together to make a history of climate change so that more people understand how the climate was disrupted by the burning of fossil fuels and vast damage to land and nature. We also want to make climate disruption a thing of the past, which is helped by understanding the historical and political dynamics that have prevented positive change and how we can overcome these.
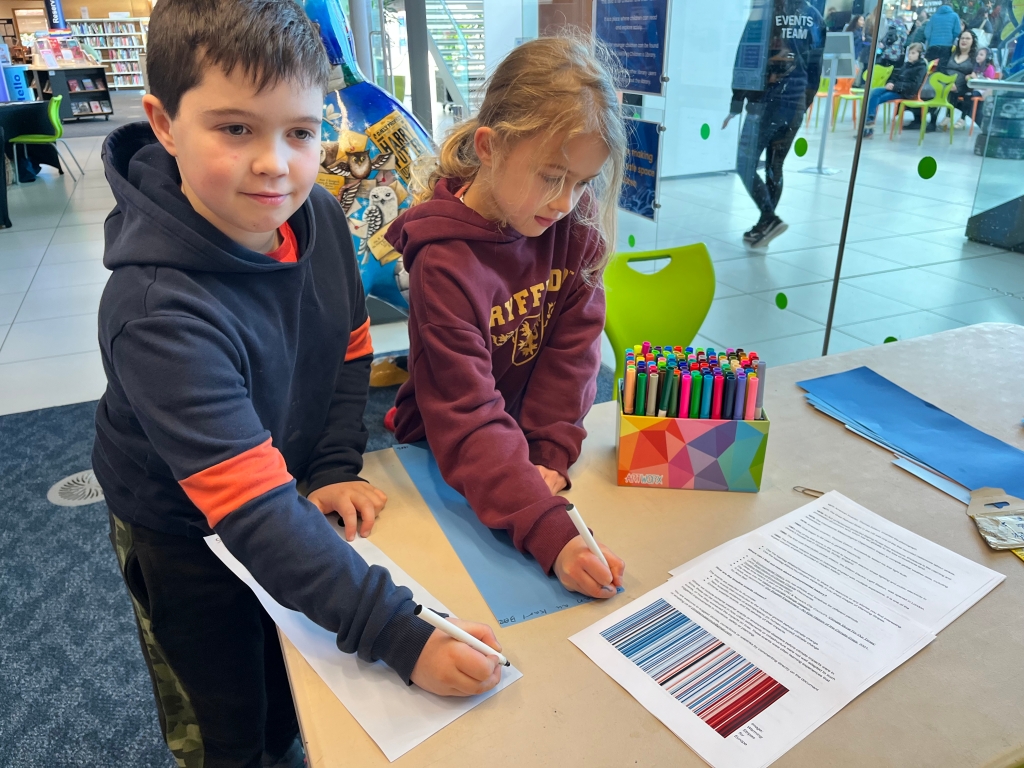
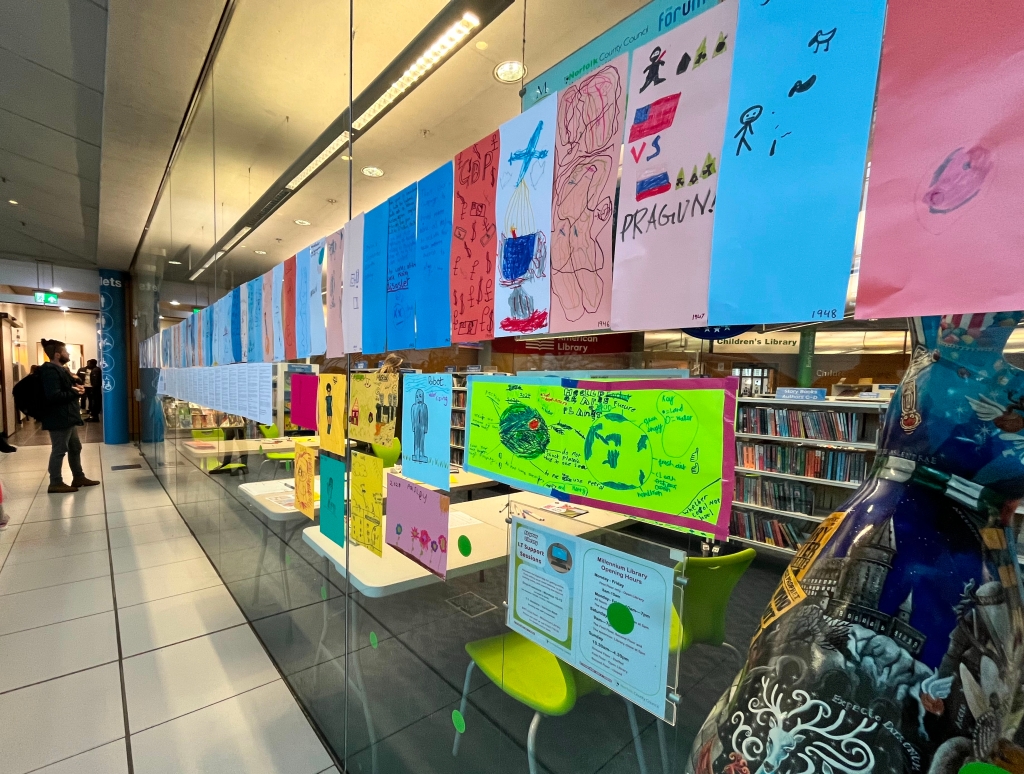
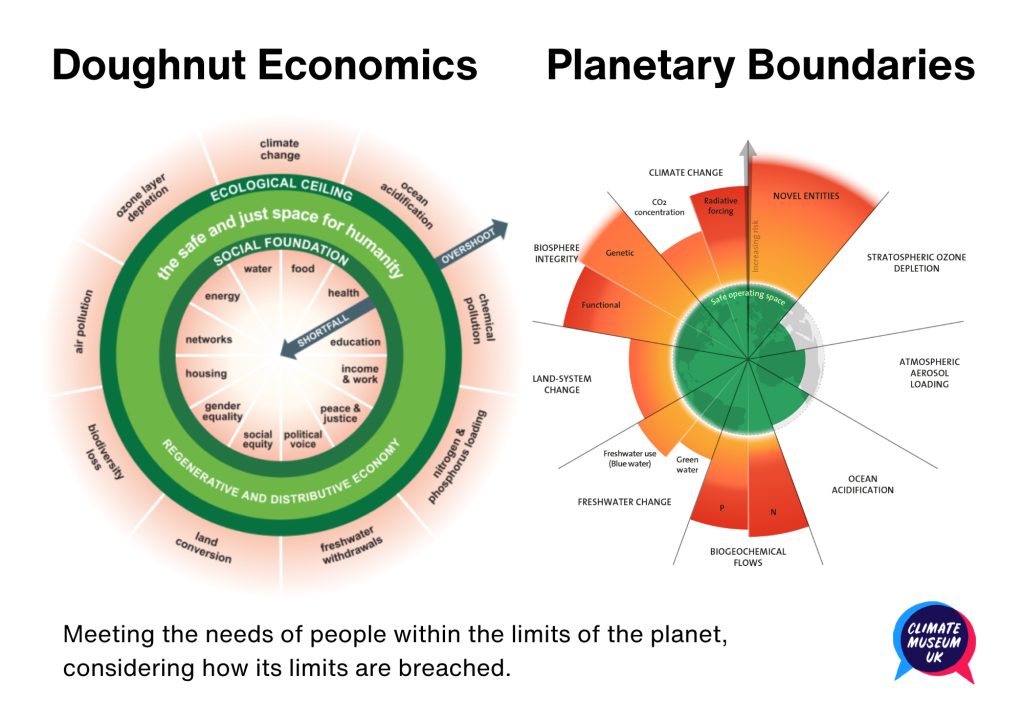
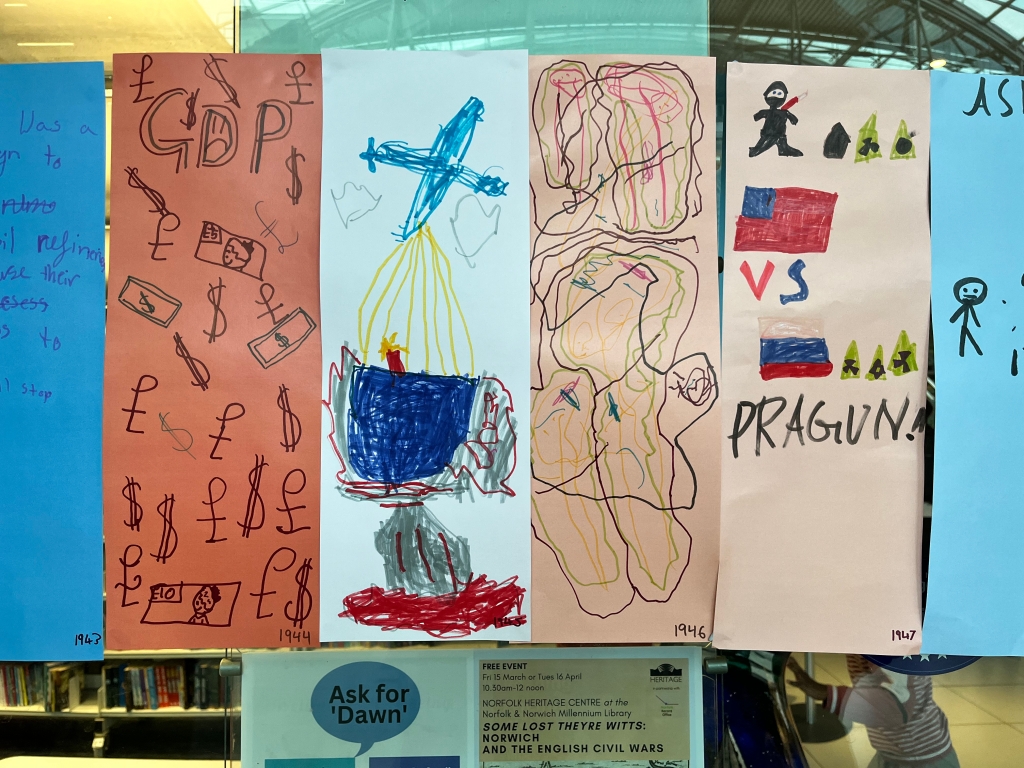
We invited visitors to create a long mural of the Warming Stripes, each coloured stripe representing a year since 1885. We had available lots of books that the librarians had selected and a timeline resource we had prepared. Our version of the timeline highlighted some local stories, such as the first working large-scale heat pump that was built for the City Council by its engineer John Sumner. We also had a poster with both the Doughnut and the Planetary Boundaries on, to see how we need to make positive changes in the challenging context of the Earth crisis.
On their stripe, participants drew and wrote something that happened in that year to cause, indirectly worsen or prove global warming.
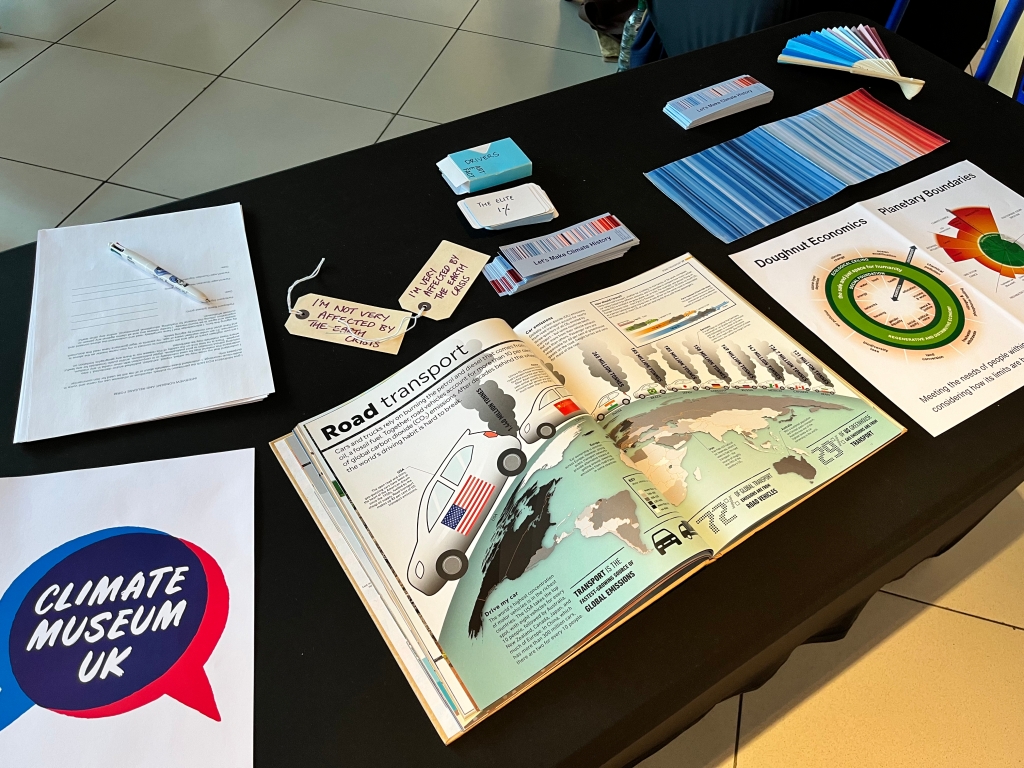
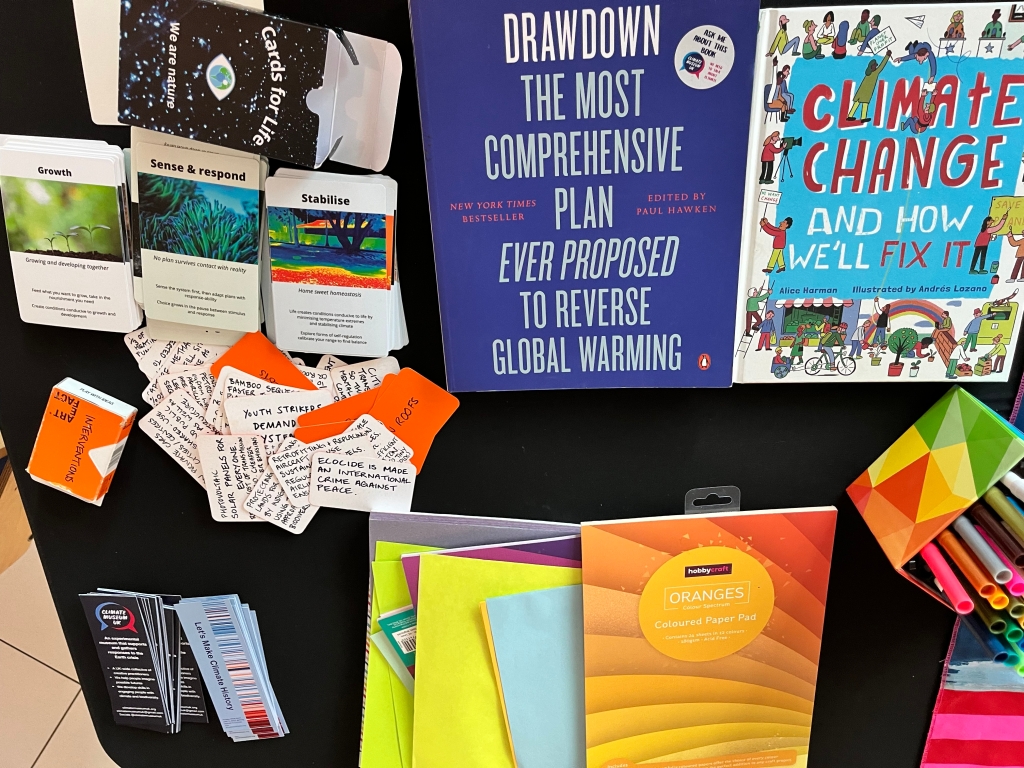
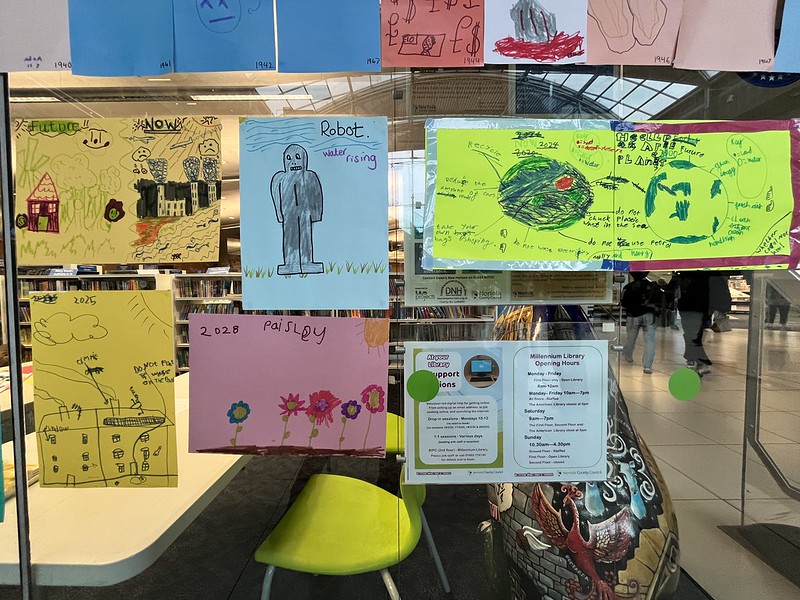
They also drew their dreams of a future that is climate-safe on a healthy planet, informed by some resources that we had available (some cards with solutions written on them, based on Project Drawdown, and the Cards for Life by Tom Mansfield). But, how can we create a safer world for them, as children surely can’t do it without us?
In Norfolk, the Conservative County Council and nine Conservative MPs (not the Labour MP, Clive Lewis) justify a new road across a biodiverse river valley or North Sea oil rigs with claims of providing jobs and cheaper goods. However, their claims do not account for knock-on effects leading to more extreme weather, higher food prices, worse health and lower productivity. These knock-on effects are already harming people and wildlife, but their impacts will be increasingly falling as burdens on the shoulders of our children.
We need a shift in mindsets, to overcome misinformation that breeds denial and delay of environmental action. In our work in Climate Museum UK, we are sharing inspiring stories of what works, and we help people to imagine, demand and build the more just and safe world we urgently need.
#MakeClimateHistory #ShowYourStripes